
Fishbone Diagram - Ursachen-Folgen-Kette - Ursache-Wirkungs-Diagramm
Application - Use - Example - Tools - Templates
Application
A diagram showing one problem and its large number of possible causes. The detailed causes will be attached to a small number of categories. So the completet diagram looks like the skeleton of a fish.
The fishbone diagram is used for
- a clear representation of the problem in the general context and
- a suggestion of the team members to identify the problem causes due to their own knowledge.
Use
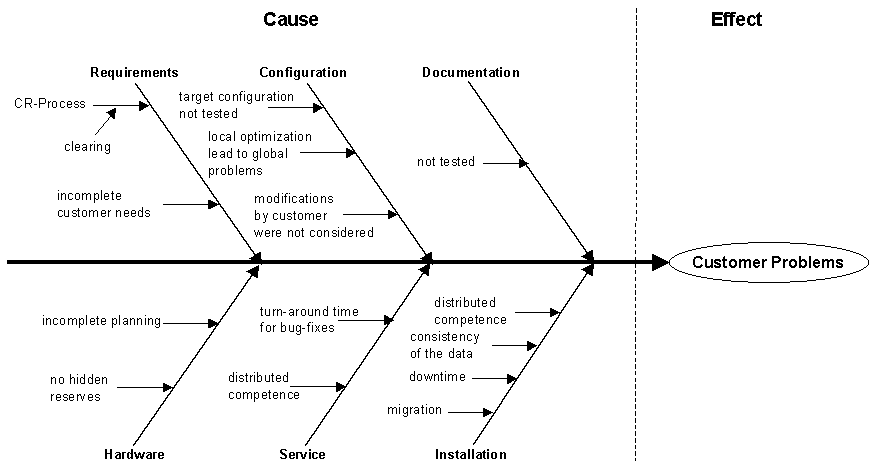
| Write the problem on the right-hand side of the Page. Draw a large arrow pointing towards the problem. | |
| Draw smaller arrows indicating the main categories of causes (a good many times 6-M-Method: Man, Management, Material, Method, Machine und Milieu (ambience)). | |
| Brainstorm for detailed causes within the main categories. Attach each detailed cause to the appropriate main category. | |
| Break down the detailed causes by brainstorming for further particulars. |
Example
A search for potential error causes.
Tools
MS Excel.